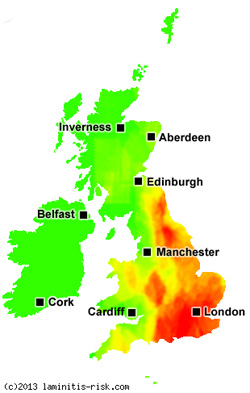


At the heart of the Grazing Risk Monitoring Service is a computer system that gathers weather data from thousands of weather stations located around the world. Each data feed is analysed using multiple analytical methods to detect a wide range of weather patterns. This data is then further processed and combined into a single overall risk index. It is this index that is presented in the Laminitis App for your chosen location.
This project builds upon existing scientific research and enhances it with ongoing research and development. The result is a sophisticated computer model capable of assessing grazing risk based on multiple weather parameters. When a location is selected, the model also considers the types of grasses native to the region. For example, C3 grasses (Cool Season Grasses) tend to accumulate non-structural carbohydrates (NSCs), while C4 grasses (Warm Season Grasses) accumulate starch. In some regions, both types coexist, dominating at different times of year. Increased levels of NSC or starch in grasses can raise grazing risks, particularly for horses susceptible to laminitis.
Throughout the development of our service, we have rigorously tested our predicted grazing risk levels against confirmed laminitis cases. While the initial focus was on the UK, the project has since expanded to include cases from a variety of climates and geographical regions worldwide. This global approach enables us to validate and refine our model under a wide range of environmental conditions and grass types. Each case we review—whether from the UK or overseas—adds vital insights that help improve the model's sensitivity and accuracy. These ongoing refinements ensure that our predictions remain robust, reliable, and relevant across diverse grazing contexts.
To maintain high levels of accuracy and reliability, we carry out regular testing and validation of the data presented in the Laminitis App. Our team conducts frequent audits of the system’s output by comparing predicted risk levels against updated real-world cases and environmental data. In addition, automated processes run scheduled consistency checks across all weather data feeds and model calculations. These efforts ensure that any anomalies or shifts in data patterns are quickly identified and addressed. This cycle of continual monitoring and validation serves as a critical quality control measure, reinforcing our commitment to providing a trustworthy, science-based tool for horse owners.
This product has been designed to build awareness amongst horse owners that stressed grass poses an unforeseen risk throughout the year and not just at Spring and Autumn. It is hoped that the Laminitis App will be used as an everyday tool in conjunction with correct animal husbandry as it is important to understand that there are many other factors that can contribute or cause laminitis in horses (e.g. obesity).